


Introduction
You're walking the third floor of a residential refurbishment. A tile has lifted, there's a crack in a freshly built partition, and a socket has ended up in the wrong place. You pull out your phone, type "crack in the bathroom on the 3rd" into the WhatsApp group and fire off a photo. Two days later the bricklayer goes up to fix it and can't find the right bathroom: there are three on that floor, and a tight close-up photo tells him nothing about its surroundings. He loses half a morning. He calls you. You go up. And between the two of you, you end up pointing at the wall with a finger.
This small disaster repeats itself daily across thousands of sites. The underlying problem isn't a lack of communication — it's that the description of a problem and its location travel down separate channels. The text says one thing, the photo shows a detail with no context, and the exact position lives only in the head of whoever saw it. The result is wasted trips, misunderstandings with subcontractors, and tickets nobody knows where to resolve.
The fix is as old as a pin in a corkboard, but moved onto the digital plan: open the floor plan on a tablet, drop a colored pin right on top of the spot where the problem is, and let that single gesture create the issue ticket. In this article we walk through how visual issue pinning on floor plans works in Tabiquo, what happens to that pin afterward, and why it changes the way a site documents itself.
The plan as a working canvas, not a dead file
Uploading drawings and organizing them by level
It all starts with keeping the plans alive inside the project. From the admin panel, in the project's Floor Plans section, you upload the site PDFs: the ground floor, the first, the second, sections, services. Each plan is classified by type — architectural, structural, electrical, plumbing, HVAC or other — and tagged with a level or floor. That level tag isn't decorative: the viewer automatically groups plans by floor and orders them, so a project with twenty sheets doesn't become an endless list but a clean tree you browse level by level.
It's worth stressing one deliberate detail: the viewer works with PDF. It isn't a CAD viewer and it doesn't ask you to export to a proprietary format; you upload the same PDF you already work with and it renders as-is, every page included. If a single file has multiple sheets, the viewer carries page navigation so you can jump between them without leaving the plan.
When a plan stops being relevant — because a revision arrives, because that phase is done — it isn't destructively deleted: it's deactivated. The plan disappears from the viewer and the lists, but the history and the issues attached to it still exist. And if you upload a new version of the PDF, the system stores the file version alongside each pin, so you always know which revision of the plan a given problem was marked against.
A viewer you handle like a map
Opening a plan in Tabiquo feels more like using a map app than opening a PDF in a classic reader. The viewer lets you zoom and pan with gestures: you zoom in with the buttons or by pinching, the zoom percentage is shown at all times, and there's a "fit" button to reframe the whole sheet. On a tablet on site, this means you can magnify down to a specific room to drop the pin with centimeter precision, then zoom back out for the overall picture.
In the side column, each plan shows a pin counter: at a glance you know the first floor has accumulated eight issues and the roof only one. The plan you're looking at is held in the URL, so if you share the link or reload, you land back in exactly the same place.
The gesture that creates the ticket: dropping the pin
Toggling pin mode and dropping the pin
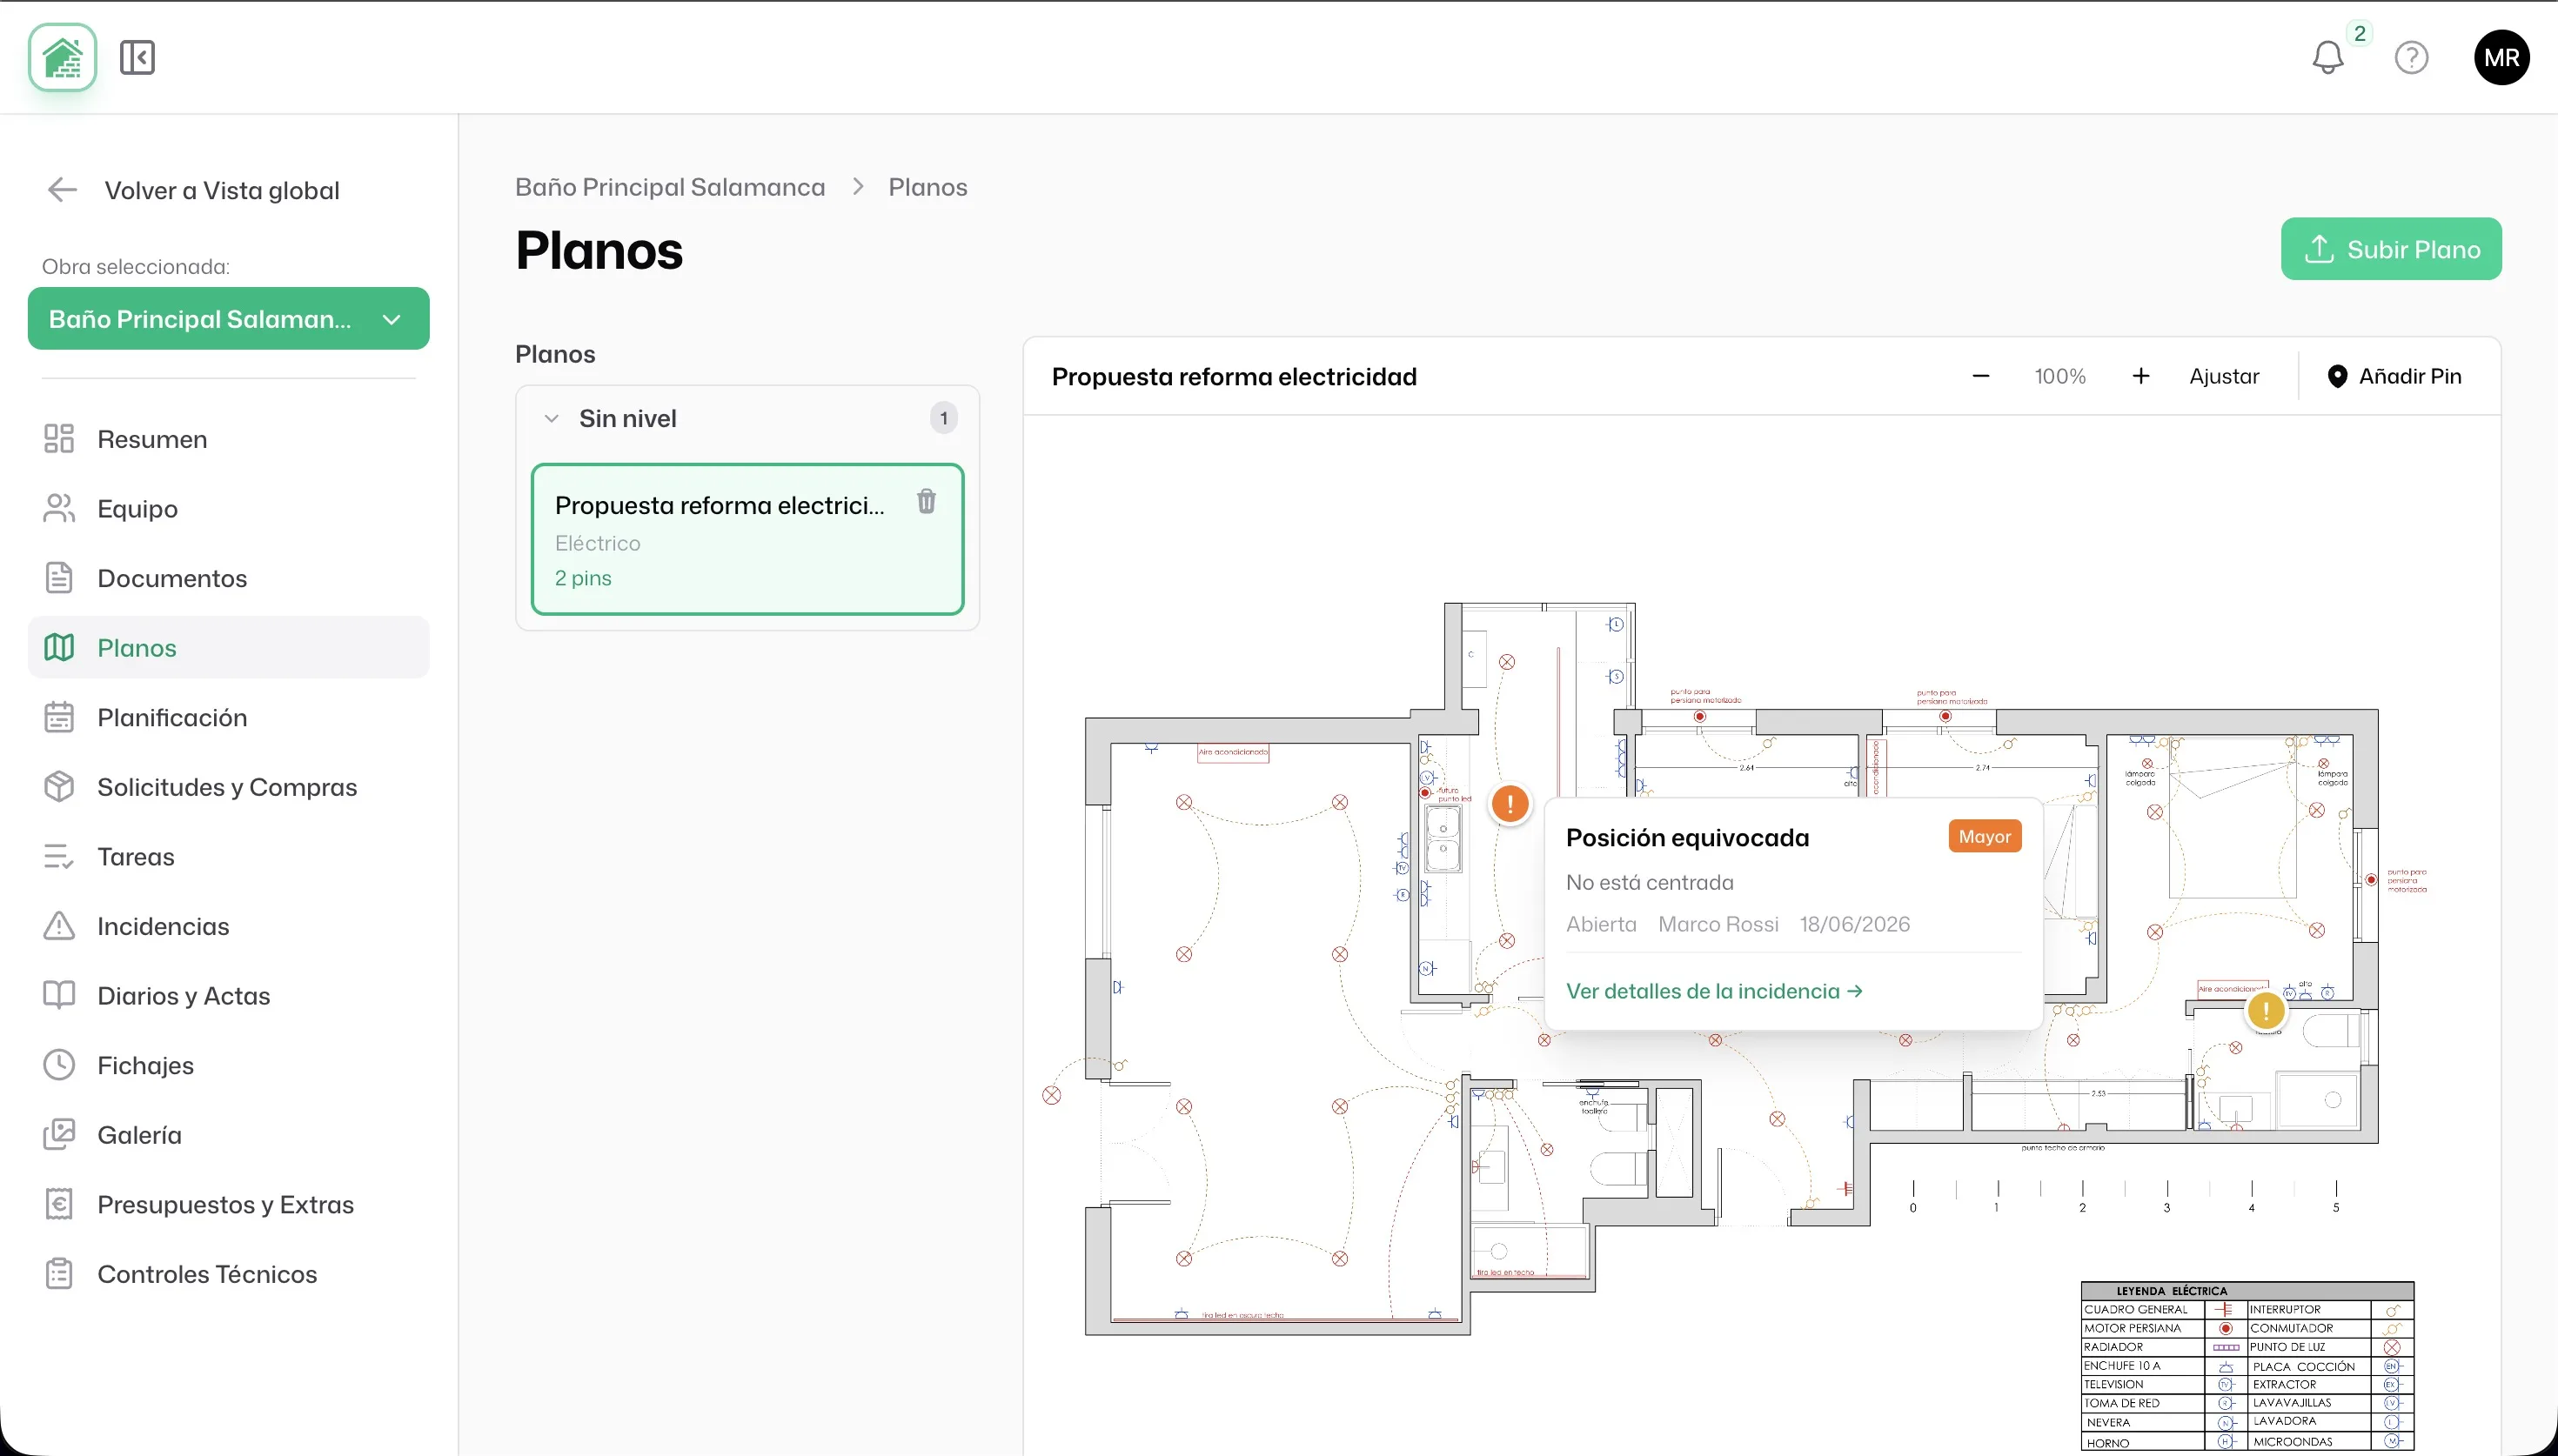
This is the heart of the feature. The viewer toolbar carries a pin-mode toggle. While it's off, you pan and zoom freely. When you turn it on, the plan becomes a canvas: the next click — or tap, on the tablet — doesn't move anything, it drops a pin at that exact point and opens a form to describe the problem.
What the system stores isn't an arbitrary pixel but the relative position inside the plan, expressed as percentages: an X and a Y coordinate between 0 and 100, plus the page number. Why percentages rather than pixels? Because that way the pin survives changes of size and device: it looks just as right on the foreman's phone as on the big office screen, and it stays anchored to the drawing, not to the image resolution.
In the form that appears when you drop the pin you capture the essentials: a title, the severity (minor, moderate, major or critical), a description, and optionally a text location reference. On confirmation, that gesture creates a complete issue in the project, with status "open" and anchored forever to those coordinates on the plan. You haven't filled in a form and then, separately, tried to explain where it was: the where and the what are born together, in a single move.
Color speaks: severity encoded in the pin
The pin isn't a neutral dot. Its color is derived automatically from the severity you assigned: a critical issue drops in red, a major one in orange, a moderate one in yellow, and a minor one in blue. This turns the plan into an instant heat map of the site's problems. When the site manager opens the first floor and sees three red pins clustered in the wet area, he knows without reading a single word where the risk is concentrated.
Each issue also gets a sequential number per project — #1, #2, #3… — a counter that's never reused even if a ticket is deleted. So in a site meeting someone can say "14 is still open" and everyone knows what they mean. The reference is stable over time: today's #14 will always be #14.
Moving and repositioning existing pins
Sometimes the issue already exists — it was raised in an inspection, it came in through another channel — and all that's missing is its location. Tabiquo lets you place or move the pin of an issue that's already created: you enter the plan from that issue, the viewer preselects the sheet it was anchored to (if any), and you drop the pin again in the right spot. The coordinates update along with the file version, without touching the rest of the ticket.
From field to office: the same pin everywhere
From the phone, on the ground
Pinning doesn't live on the desktop alone. The mobile app consumes the same data through the API: a foreman can pull the project's plan list grouped by level, with the number of pins each one already carries, open a specific plan and see all its pins already placed. And, crucially, he can create the issue with its coordinate straight from the phone, attaching photos — and even videos — taken in that very moment. The server validates that the coordinate falls inside the plan (that 0-to-100 range we mentioned) and that the plan genuinely belongs to the project, so you never end up with orphaned or misassigned pins.
When an issue is created, the project lead receives an automatic notification. The ticket doesn't sit waiting for someone to refresh a screen: the alert arrives on its own.
Who gets to draw on the plan
Not everyone needs the same permissions. Reading the plans and their pins is open to any project member, but uploading new drawings is a management action: clients and workers with basic access can't do it. That way a client can come in and see the state of their home on the plan without any risk of altering the technical documentation.
The report that redraws the pin
Marking the problem is half the story; the other half is communicating it to whoever has to fix it — often a subcontractor who doesn't use the app. For that, Tabiquo generates an incident PDF report that doesn't just list text: it redraws the pin on the plan.
Overview and close-up
In the report's detailed mode, each issue gets its own card with its number, severity, description and status. And below it appears the pair of images that changes everything: on the left, an overview of the plan with a red rectangle marking the problem zone; on the right, a magnified close-up of that same zone with the colored pin dropped at the exact point, the tip of the pin resting on the original coordinate. Whoever receives the report understands in two seconds where the problem is: they see the general context and the detail, with no ambiguity.
To make those images come out sharp, the system rasterizes the plan's PDF page at high resolution and crops it centered on the pin — a process that's cached so the work isn't repeated on every download. The result is a crop that holds up to zooming and printing without pixelating.
The photos, anchored to the ticket
To that cartography it adds the evidence photos taken when the issue was created, embedded directly in the PDF with their dates. The report can be generated from a single issue's card, from the project's issue list, or as a bulk action to print several tickets at once — ideal for taking into a meeting with the design team or handing a contractor the complete package of what they have outstanding. Issues are grouped so the document stays readable, and although this article doesn't get into the resolution cycle, the report reflects each one's status (open, resolved, closed) so the recipient knows what's still live.
Conclusion
The difference between "there's a crack in the bathroom on the third" and a red pin dropped on the exact point of the third-floor plan isn't cosmetic: it's operational. One eliminates the wasted trip, the misunderstanding and the wall pointed at with a finger. The other multiplies them. When a problem's location and description are born from the same gesture, on the real drawing of the building, the site stops running on memory and scattered conversations and starts documenting itself.
Visual issue pinning on plans is one of those features that look small but save hours every week: the foreman drops the pin in thirty seconds, the color flags the severity, the issue is born numbered, and when needed the report redraws everything on the plan for whoever doesn't open the app.
If your studio or refurbishment company still chases issues through WhatsApp and loose notes, try moving them onto the plan. In Tabiquo you can upload your drawings as PDF, mark problems where they actually are, and produce the visual report in a couple of clicks. Sometimes the biggest improvement on a site starts with a single pin.